Sweep: scale¶
Varies: scale factor f — terrain ×f, nodes ×f² (50 → 200 nodes).
← Benchmark index · Metrics · Methodology
Provenance — measured at
v1.3.0. Every number on this page was produced by the campaign runs named below, all of which predate thev1.3.0tag (19009be). No commit betweenv1.2.0and that tag changes routing behaviour, so checking outv1.3.0reproduces these cells. The default branch will not: it has since changed the pheromone weighting (#327,betaAnts/betaData2.0 → 20) and the per-seed RNG stream assignment (#352), either of which moves measured values. See Provenance and #365.Restated on CBR sources (#521). The pinned table below was measured at half the documented offered load. A 20-seed re-measure on
mainis under Restated on CBR sources at the end of this page.OLSR's PDR column is inflated (#510). These cells predate the fix that counts a send stock OLSR refuses at the source as an offered packet (PR #511,
f480d0ae). Before it, OLSR's PDR was computed over the ticks it had a route for. This page stays pinned tov1.3.0and is not re-measured. The offered-based value below is estimated from this table's own columns, asthrput_olsr / thrput_aodv × PDR_aodv. On these aggregate rows the same estimate reproduces AntHocNet's and DSDV's reported PDR to within ~0.6 pp, which is the throughput rounding.
scale f OLSR PDR as published offered-based estimate DSDV PDR 1.0 74.8 ≈ 73.1 (-1.7) 69.1 1.4 61.3 ≈ 61.2 (-0.0) 56.1 1.8 51.2 ≈ 50.7 (-0.5) 46.4 2.0 47.6 ≈ 47.2 (-0.4) 39.4 The correction reaches 1.7 pp. Where it brings OLSR within about 2 pp of DSDV, do not quote an OLSR-over-DSDV ordering from this page. AntHocNet, AODV and DSDV are unaffected.
What it varies¶
Reproduces Fig. 3 of the AntHocNet paper (Di Caro/Ducatelle/Gambardella, PPSN VIII 2004, §4): terrain is scaled by f and node count by f², holding node density roughly constant while the network grows. Unlike the paper (AODV only), every baseline is run on identical realisations.
Defined as SWEEPS["scale"] in
ns3/tools/run-scenarios.py — the points
are f = 1.0 (50 nodes, 1500×500 m), 1.4 (98, 2100×700), 1.8 (162, 2700×900) and
2.0 (200, 3000×1000).
How it is produced¶
Sweeps are too heavy for the per-merge benchmarks workflow, which runs
only the discrete scenarios. They came from the manual Scenario matrix +
charts workflow (scenario-matrix.yml, removed in v2.5.0, #746), which
uploaded the classified CSV; the table below is filled in by pointing
update-benchmarks.py at that CSV, and charts.yml re-renders sweep-scale.png
from it. A new sweep is a campaign plan of one cell per point on
benchmark-cell.yml (tools/bench/campaign.py).
Raw sweep data rescued from expired artifacts lives in
results/campaign/ and is summarizable with the benchmark-results
skill's sweep_summary.py. This sweep is the one that had to be seed-split
to run at all — see the provenance note below.
Results¶
Post-#88/#169, 20 seeds, 95% CIs. These numbers include the
T_hop= 3 ms fix (#88, PR167) and the reactive-hop-cap removal¶
(#169, PR #170), and meet the methodology runs floor. AntHocNet leads delivery at every point (+11.0 to +17.8 pp, intervals disjoint except at f = 2.0) while carrying 16–29 % lower normalized routing load. The
delay99column is worse throughout — the confirmed #21 tail, whose remediation is tracked in #308 against a like-for-likep99Commontarget. Do not quotepath_div_*/entropyfrom these cells (#230).
Provenance — and why this sweep needed seed-splitting¶
Dispatched 2026-08-03/04 on main, scenario-matrix.yml, 3.42-opt image,
900 s, range/disk PHY, 20 seeds per point. The f = 1.0 point ran as a single
20-seed job; the other three exceed the 340-minute step ceiling at 20 seeds
and were run as multiple dispatches over disjoint seed ranges using the
runFirst input (#126,
PR #322), then recombined with
pool_runs.py, which
recomputes each mean and standard deviation from the pooled per-run rows
(#319) rather than
combining split aggregates. Seed coverage was verified as exactly 1–20 per
protocol per point, with no gaps and no duplicates.
| point | nodes | dispatches | run IDs |
|---|---|---|---|
| f = 1.0 | 50 | 1 × 20 seeds | 30854990473 |
| f = 1.4 | 98 | 2 × 10 seeds | 30876649282, 30876656386 |
| f = 1.8 | 162 | 6 × 3 + 1 × 2 seeds | 30898626094, 30898635717, 30898646523, 30898656990, 30898670257, 30898680790, 30898694649 |
| f = 2.0 | 200 | 18 × 1 + 1 × 2 seeds | 30898711742, 30898724984, 30898736284, 30898751349, 30898769563, 30898781607, 30898794804, 30898809114, 30898820499, 30898833922, 30898846247, 30898858035, 30898870503, 30898882109, 30898892224, 30898902277, 30898913177, 30898925485, 30876743751 |
The pooled inputs are committed as
results/campaign/pooled-scale-{1.4,1.8,2.0}-20260804.csv (plus their per-run
siblings); f = 1.0 predates #319 and has no sibling, so it is published from
its aggregate CSV unchanged.
Measured simulation cost per seed, by field size (900 s sim, -opt image,
queue-delayed jobs excluded so these are compute time, not wall-clock):
| point | nodes | min/seed | growth exponent vs previous point |
|---|---|---|---|
| f = 1.0 | 50 | 5.0 | — |
| f = 1.4 | 98 | 20.7 | 2.12 |
| f = 1.8 | 162 | 98.2 | 3.09 |
| f = 2.0 | 200 | 186.4 | 3.04 |
Cost grows faster than quadratically in node count, and the exponent itself rises with field size — which is why the first seed-split attempt (sized by extrapolating the 50 → 98-node curve) still lost its f = 1.8 and f = 2.0 chunks to the ceiling, and why the successful sizing came from measuring per-seed cost at each field size. The whole sweep is ≈ 116 CPU-hours. Anyone re-running it should size chunks from the table above rather than from a two-point extrapolation.
Sweep scale — mean of 20 run(s) per point, every baseline on identical realisations; ± is the 95% CI half-width (#293). Generated by run-scenarios.py; chart by make-charts.py.
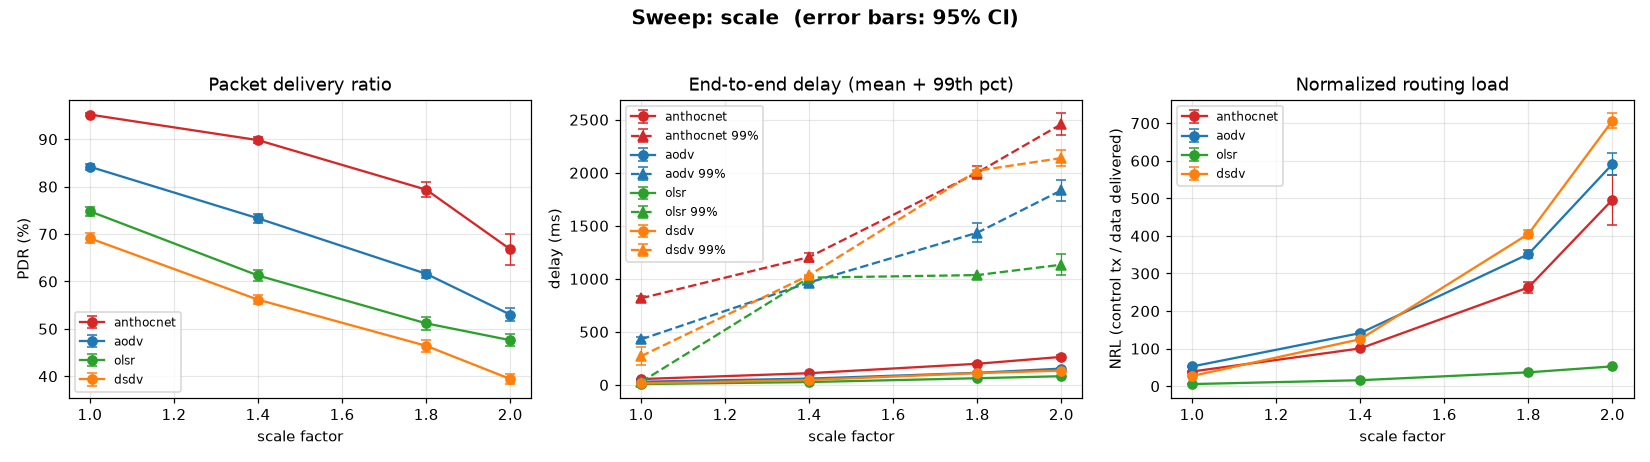
| scale factor | protocol | PDR % ±95 | mean delay (ms) ±95 | 99th delay (ms) ±95 | throughput (kbps) | NRL ±95 | jitter (ms) | dOff90 (ms) |
|---|---|---|---|---|---|---|---|---|
| 1.0 | anthocnet | 95.2 ± 0.3 | 54.9 ± 2.3 | 816.6 ± 25.7 | 6.25 | 38.963 ± 0.46 | 88.32 | 283.6 |
| 1.0 | aodv | 84.2 ± 0.6 | 29.8 ± 1.5 | 429.1 ± 25.5 | 5.55 | 52.419 ± 0.89 | 43.91 | inf |
| 1.0 | dsdv | 69.1 ± 1.1 | 14.3 ± 0.8 | 270.6 ± 82.1 | 4.59 | 27.127 ± 0.49 | 22.65 | inf |
| 1.0 | olsr | 74.8 ± 0.9 | 7.9 ± 0.4 | 26.5 ± 0.9 | 4.82 | 5.572 ± 0.09 | 10.68 | inf |
| 1.4 | anthocnet | 89.8100 ± 0.6 | 110.3200 ± 4.8 | 1205.3000 ± 42.5 | 5.9485 | 100.4570 ± 2.40 | 164.9015 | inf |
| 1.4 | aodv | 73.3150 ± 1.0 | 59.2650 ± 3.2 | 965.3000 ± 37.6 | 4.8160 | 141.1965 ± 3.47 | 84.7745 | inf |
| 1.4 | dsdv | 56.1500 ± 0.9 | 45.9450 ± 2.8 | 1033.7500 ± 3.9 | 3.7230 | 125.0810 ± 2.19 | 79.5920 | inf |
| 1.4 | olsr | 61.2550 ± 1.2 | 26.8300 ± 1.9 | 1011.2000 ± 1.3 | 4.0215 | 15.8410 ± 0.32 | 42.3560 | inf |
| 1.8 | anthocnet | 79.3600 ± 1.5 | 199.2450 ± 10.6 | 2001.2000 ± 58.3 | 5.2315 | 262.8115 ± 15.74 | 275.6305 | inf |
| 1.8 | aodv | 61.6100 ± 0.8 | 113.6750 ± 5.4 | 1434.7500 ± 89.1 | 4.0890 | 351.4885 ± 10.59 | 158.7285 | inf |
| 1.8 | dsdv | 46.4200 ± 1.3 | 111.3800 ± 3.2 | 2019.4500 ± 3.3 | 3.0610 | 405.1405 ± 10.59 | 188.1960 | inf |
| 1.8 | olsr | 51.1600 ± 1.3 | 62.9050 ± 4.7 | 1035.3500 ± 3.3 | 3.3620 | 36.8080 ± 0.96 | 102.3335 | inf |
| 2.0 | anthocnet | 66.7850 ± 3.2 | 263.9800 ± 18.9 | 2458.6500 ± 102.2 | 4.4380 | 496.3050 ± 66.88 | 346.9210 | inf |
| 2.0 | aodv | 53.0000 ± 1.3 | 153.5750 ± 9.4 | 1834.5500 ± 100.3 | 3.5090 | 591.2330 ± 29.58 | 205.7745 | inf |
| 2.0 | dsdv | 39.4200 ± 1.1 | 134.8800 ± 6.6 | 2138.9000 ± 74.2 | 2.6145 | 706.8070 ± 19.55 | 222.6235 | inf |
| 2.0 | olsr | 47.6050 ± 1.3 | 81.9950 ± 3.9 | 1133.2500 ± 99.5 | 3.1260 | 52.7170 ± 1.53 | 134.3915 | inf |
Restated on CBR sources (#521)¶
Re-measured on constant-bit-rate sources. Until #521 every source ran ns-3's default 1 s on / 1 s off, so the pinned table above was taken at half the documented offered load. That table stays as the dated
v1.3.0record.Provenance.
main@3edbab6a,3.42-opt, 900 s, range/disk PHY, 20 seeds per point (seeds 1–20 at every point, checked per arm). The large points were seed-split under the 340-minute step ceiling and pooled withpool_runs.py:
point nodes dispatches runs f = 1.0 50 1 × 20 seeds 37233299992f = 1.4 98 4 × 5 seeds 37233301825,37233303652,37233305484,37233307071f = 1.8 162 1 + 6 × 3 + 1 seeds 37233308743,37245033305,37245034720,37245035898,37245037135,37245038377,37245039781,37245041291f = 2.0 200 20 × 1 seed 37233310160,37245045391,37245046905,37245048133,37245049690,37245051438,37245052799,37245054608,37245056047,37245058610,37245060289,37245061876,37245063971,37245065248,37245066748,37245068375,37245069836,37245071215,37245072592,37245073899Pooled inputs:
results/campaign/pooled-scale-{1.4,1.8,2.0}-20261005.csvplus their-runs.csvper-seed siblings; f = 1.0 isresults/campaign/37233299992-run.csvunchanged.scenario_check.py results: 0 FAIL; the 4 WARNs are the #230 path-diversity window caveat. OLSR's PDR is offered-based (#510), so the estimate table at the top of this page does not apply to this block.Attribution. This is not a CBR-only A/B.
3edbab6aalso carries every change afterv1.3.0that the provenance note names (#327 pheromone weighting, #352 RNG streams), plus #510 (OLSR accounting) and522 (TTL compensation).
sweep_summary.py --vsthe pinned CSVs reports¶its baseline control as FAIL, as expected: every arm's offered load doubled. Quote this block's within-point orderings and paired deltas, not its difference from the pinned table.
Sweep
scale— mean of 20 run(s) per point, every baseline on identical realisations; ± is the 95% CI half-width (#293). Rendered withupdate-benchmarks.py's sweep builder from the pooled CSVs.
Reproduce:
make reproduce FIG=sweep-scalere-renders it from the committed data and diffs the PNG (#621).
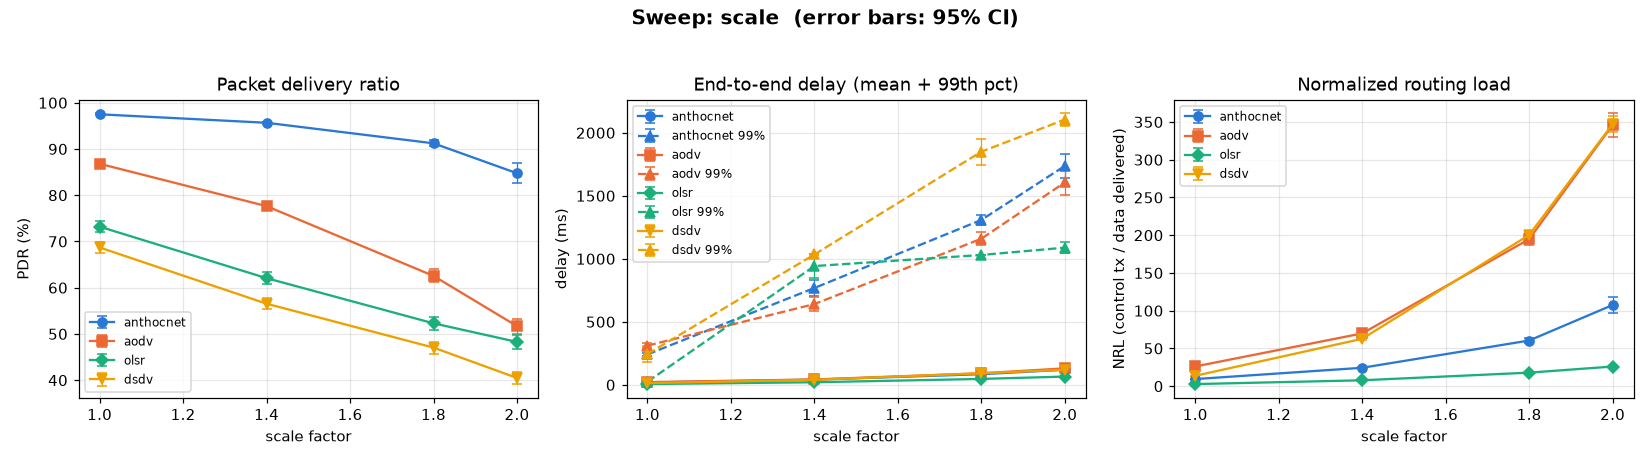
scale factor protocol PDR % ±95 mean delay (ms) ±95 99th delay (ms) ±95 throughput (kbps) NRL ±95 jitter (ms) dOff90 (ms) 1.0 anthocnet 97.5 ± 0.2 18.3 ± 0.7 241.6 ± 9.4 12.84 9.394 ± 0.28 27.33 42.4 1.0 aodv 86.8 ± 0.8 21.7 ± 1.0 311.1 ± 19.1 11.43 26.101 ± 0.47 32.24 inf 1.0 olsr 73.2 ± 1.1 6.2 ± 0.5 24.6 ± 1.7 9.64 2.768 ± 0.04 7.94 inf 1.0 dsdv 68.7 ± 1.3 13.4 ± 1.0 244.4 ± 59.8 9.04 13.736 ± 0.26 20.42 inf 1.4 anthocnet 95.6650 ± 0.3 40.9600 ± 1.8 768.5000 ± 59.8 12.6005 24.3580 ± 0.82 59.5450 172.3000 1.4 aodv 77.6350 ± 0.9 42.7700 ± 2.2 641.0000 ± 54.6 10.2240 69.9130 ± 1.68 61.1590 inf 1.4 dsdv 56.5350 ± 1.2 39.9500 ± 1.9 1034.2500 ± 3.7 7.4450 62.7480 ± 1.25 65.0425 inf 1.4 olsr 62.0600 ± 1.3 20.3600 ± 1.4 942.5000 ± 94.0 8.1730 7.7995 ± 0.16 31.7790 inf 1.8 anthocnet 91.2250 ± 0.6 84.4500 ± 4.8 1308.4500 ± 42.7 12.0180 60.4910 ± 3.16 116.5865 690.9350 1.8 aodv 62.5450 ± 1.4 91.5650 ± 4.9 1159.3500 ± 50.8 8.2380 194.7925 ± 7.88 117.3245 inf 1.8 dsdv 47.0450 ± 1.3 91.7600 ± 3.7 1849.8500 ± 101.8 6.1985 200.3500 ± 5.37 139.2750 inf 1.8 olsr 52.2950 ± 1.4 46.8350 ± 2.8 1030.3500 ± 2.9 6.8865 17.9105 ± 0.52 74.4665 inf 2.0 anthocnet 84.7500 ± 2.1 119.6700 ± 7.8 1736.8500 ± 98.3 11.1610 107.4875 ± 10.03 158.8540 117.1500 2.0 aodv 51.6850 ± 1.6 130.7000 ± 6.0 1606.0500 ± 98.4 6.8055 346.0735 ± 15.48 155.4535 inf 2.0 dsdv 40.4750 ± 1.3 119.7900 ± 5.4 2105.2500 ± 49.5 5.3290 347.2165 ± 10.60 168.6730 inf 2.0 olsr 48.2700 ± 1.5 65.4800 ± 3.5 1088.4500 ± 41.1 6.3575 26.0180 ± 0.73 103.7370 inf Paired per-seed deltas, AntHocNet minus each baseline unless named (mean ± 95 % CI half-width, 20 seeds; ns = the CI spans zero):
scale f ΔPDR − aodv (pp) ΔPDR − olsr (pp) ΔPDR − dsdv (pp) Δ delay99− aodv (ms)Δ delay99− olsr (ms)Δ delay99− dsdv (ms)ΔNRL − aodv ΔPDR olsr − dsdv (pp) 1.0 +10.8 ± 0.7 +24.3 ± 1.0 +28.9 ± 1.2 −70 ± 20 +217 ± 9 −3 ± 59 (ns) −16.71 ± 0.37 +4.57 ± 0.52 1.4 +18.0 ± 0.7 +33.6 ± 1.1 +39.1 ± 1.1 +128 ± 69 −174 ± 94 −266 ± 59 −45.56 ± 1.53 +5.52 ± 0.53 1.8 +28.7 ± 1.1 +38.9 ± 1.0 +44.2 ± 1.0 +149 ± 71 +278 ± 41 −541 ± 88 −134.30 ± 7.04 +5.25 ± 0.65 2.0 +33.1 ± 1.6 +36.5 ± 1.7 +44.3 ± 1.9 +131 ± 101 +648 ± 94 −368 ± 84 −238.59 ± 11.14 +7.79 ± 0.53 What holds and what changed versus the pinned table: - The delivery ordering holds: AntHocNet > AODV > OLSR > DSDV at every point. - AntHocNet's lead over AODV now widens all the way to f = 2.0: +10.8, +18.0, +28.7, +33.1 pp. Pinned, it peaked at f = 1.8 (+17.8 pp) and fell back to +13.8 pp at f = 2.0, where AntHocNet delivered 66.8 %. On CBR AntHocNet delivers 84.8 % at f = 2.0, with a ±2.1 pp CI against ±3.2 pinned. - AntHocNet's NRL stays below AODV's at every point, and the gap grows with the network: −16.7 at f = 1.0 to −238.6 at f = 2.0. - Tails: AntHocNet's
delay99is below AODV's only at f = 1.0; at f = 1.4 to 2.0 it is 128 to 149 ms above. It is below DSDV's at f = 1.4 to 2.0, and below OLSR's only at f = 1.4. - OLSR over DSDV holds (+4.6 to +7.8 pp, each significant), as the #510 estimate on the pinned page predicted. - OLSR's and DSDV'sdelay99sit near 1030 ms with a CI of a few ms at f = 1.4 (both) and f = 1.8 (OLSR). The pinned table shows the same plateau, so it predates #521 and is not investigated here.
Scale to 500 nodes (v2.4.0, pre-registered)¶
#62 asks for the
overhead-versus-nodes curve beyond 200 nodes, where the ACO-routing claim of
graceful scaling is tested. This is the plan, merged before its first
dispatch:
tools/bench/campaigns/v2.4.0-scale.yaml.
What is held from the sweep above:
- terrain × f and nodes × f², so density stays constant;
- random waypoint at 20 m/s with a 30 s pause, the 300 m range/disk PHY, and CBR sources.
What changes, and why:
- 300 s, not 900 s. At 500 nodes one seed of the four protocols already takes 5 h 40 min for 300 s (below). This was the maintainer's decision, 2026-10-20.
- The protocols are AntHocNet, AODV, OLSR and the oracle. The oracle bounds every point; DSDV is not run.
- One generation. The points are 50, 100, 200 and 500 nodes, all at v2.4.0. The 900 s points above are a different generation and are not joined to these.
| point | nodes | field (m) | jobs |
|---|---|---|---|
| f = 1.0 | 50 | 1500 × 500 | 1 × 20 seeds |
| f = 1.41 | 100 | 2121 × 707 | 2 × 10 seeds |
| f = 2.0 | 200 | 3000 × 1000 | 10 × 2 seeds |
| f = 3.16 | 500 | 4743 × 1581 | AntHocNet + AODV 10 × 2 seeds; OLSR 20 × 1; oracle 20 × 1 |
Sizing. Run 39527509217
ran 500 nodes, 1 seed, all four protocols, on ns3:3.42-opt:
| protocol | PDR % | NRL |
|---|---|---|
| AntHocNet | 15.2 | 5426 |
| AODV | 18.7 | 3355 |
| OLSR | 30.3 | 207 |
| oracle | 83.0 | 0 |
AntHocNet and AODV finished within about 80 minutes. OLSR and the oracle took the remaining 4.3 hours. The 500-node point is therefore split by protocol so that every job stays well under the 6 h runner limit. Each 500-node protocol group is its own cell file, and the files are read together by seed.
The readings, fixed now:
- Per point: PDR, delay99 and NRL for each protocol, with 95 % CIs over 20 seeds.
- The curve: NRL and control packets per node against node count, for each protocol. This is #62's chart.
- Per point, paired per seed:
- AntHocNet − oracle;
- AntHocNet − the best native baseline (AODV or OLSR, by highest mean PDR).
These are the same two terms as the cross-family view (ADR-0026).
Already visible in the sizing seed: at 500 nodes every routing arm delivers far below the oracle (15–30 % against 83 %), and AntHocNet's NRL is the highest. That is one seed, not a result. If it holds at 20 seeds, it is a finding to file (ADR-0013): where and why the colony's overhead stops scaling.
Results (v2.4.0)¶
The campaign ran as planned: 63 jobs, ns3:3.42-opt, 300 s, 20 seeds per
point. The cells are results/cells/scale-{50,100,200,500}-v240.txt, plus
scale-500-olsr-v240.txt and scale-500-oracle-v240.txt.
One seed is missing: OLSR at 500 nodes has 19 seeds. A single 500-node OLSR seed takes 3.9–5.7 h. Four seeds (4, 9, 17, 20) hit the 340-minute step limit, and each was re-run once. Seeds 4, 9 and 17 then finished. Seed 20 timed out twice (runs 39715756649 and 39753891585). By the maintainer's decision (2026-10-26), OLSR at 500 nodes is reported with n = 19. Paired readings against it use those 19 seeds.
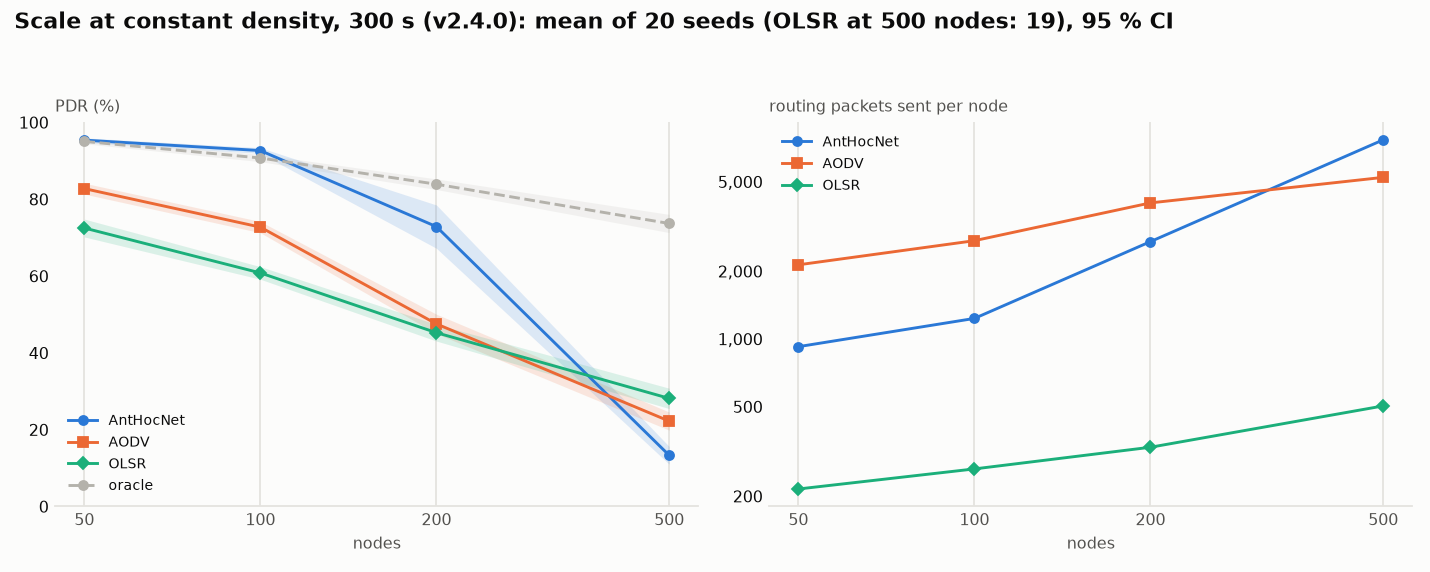
Routing packets per node are NRL × packets delivered ÷ nodes, the same
yardstick for every protocol. Drawn by
ns3/tools/family-charts.py
from the committed cells.
Mean, with the PDR's 95 % t-interval:
| nodes | protocol | PDR % | delay99 ms | NRL | routing packets per node |
|---|---|---|---|---|---|
| 50 | AntHocNet | 95.38 ± 0.58 | 436.0 | 10.97 | 924 |
| 50 | AODV | 82.75 ± 1.42 | 513.4 | 29.26 | 2 136 |
| 50 | OLSR | 72.50 ± 2.32 | 35.0 | 3.37 | 215 |
| 50 | oracle | 94.96 ‡ | 23.6 | 0 | 0 |
| 100 | AntHocNet | 92.66 ± 0.75 | 1129.5 | 30.17 | 1 234 |
| 100 | AODV | 72.72 ± 1.46 | 1062.5 | 85.32 | 2 734 |
| 100 | OLSR | 60.80 ± 1.64 | 945.6 | 9.87 | 264 |
| 100 | oracle | 90.52 ‡ | 36.5 | 0 | 0 |
| 200 | AntHocNet | 72.85 ± 5.63 | 2174.8 | 181.35 | 2 709 |
| 200 | AODV | 47.52 ± 2.53 | 2002.0 | 389.96 | 4 027 |
| 200 | OLSR | 45.23 ± 2.17 | 1322.0 | 33.35 | 330 |
| 200 | oracle | 83.64 ‡ | 211.2 | 0 | 0 |
| 500 | AntHocNet | 13.31 ± 2.31 | 3539.9 | 7482.62 | 7 679 |
| 500 | AODV | 22.22 ± 2.36 | 2934.1 | 2824.88 | 5 229 |
| 500 | OLSR (n = 19) | 28.14 ± 2.65 | 2593.8 | 211.42 | 504 |
| 500 | oracle | 73.40 ‡ | 564.6 | 0 | 0 |
‡ The oracle's PDR is restated over offered traffic. The oracle drops a
send it has no route for before the books open, so the harness's own PDR
leaves those packets out of the denominator
(#464;
scenario_check.py FAILs the 200- and 500-node oracle cells on it). There
were 83 to 342 such refusals over 20 seeds. Counting them lowers the oracle
by 0.09 to 0.27 pp: 95.05 → 94.96, 90.72 → 90.52, 83.90 → 83.64 and
73.67 → 73.40 %.
The readings, paired per seed. The gap to the oracle uses the harness's PDR, so with the restated oracle each gap is 0.1–0.3 pp smaller in magnitude.
| nodes | AntHocNet − oracle (pp) | AntHocNet − best native (pp) | d delay99 (ms) | d NRL | verdict |
|---|---|---|---|---|---|
| 50 | +0.33 [−0.45, +1.11] | +12.62 [+11.32, +13.93] (AODV) | −77.35 [−157.70, +12.85] | −18.29 | PAIRED-IMPROVED |
| 100 | +1.93 [+0.88, +2.99] | +19.93 [+18.38, +21.49] (AODV) | +67.00 [+45.50, +86.80] | −55.14 | PAIRED-MIXED |
| 200 | −11.05 [−15.87, −6.23] | +25.32 [+21.57, +29.08] (AODV) | +172.75 [+40.50, +305.25] | −208.61 | PAIRED-MIXED |
| 500 | −60.36 [−62.21, −58.51] | −14.72 [−17.11, −12.32] (OLSR) | +947.26 [+665.11, +1221.74] | +7252.74 | PAIRED-WORSE |
What they say:
- Up to 200 nodes, AntHocNet leads every native protocol, and by more as the network grows. It leads AODV by +12.6 pp at 50 nodes and +25.3 pp at 200, while sending less routing traffic than AODV at every one of those sizes. At 50 and 100 nodes it matches or beats the oracle. At 200 nodes it is 11 pp short of the oracle, and its seeds spread widely (±5.6 pp).
- At 500 nodes it collapses. AntHocNet delivers 13.3 %, against AODV's 22.2 %, OLSR's 28.1 % and the oracle's 73.4 %. It is the worst routing arm, paired against OLSR (−14.72 pp) and with a tail 0.95 s longer.
- The cause is reactive-ant flooding. AntHocNet's routing traffic per node grows 8.3× from 50 to 500 nodes; AODV's grows 2.4× and OLSR's 2.3×. Between 200 and 500 nodes AntHocNet passes AODV. Reactive ants are 27 % of its control traffic at 50 nodes and 90 % at 500. Filed as #740 for v2.5.0.
- The ACO claim of graceful scaling holds here to about 200 nodes and fails at 500. It fails on the protocol's control traffic, not on the field: the oracle still delivers 73 % at 500 nodes.
Checker (scenario_check.py results):
- The oracle cells FAIL on #464, restated above.
- Two AntHocNet seed blocks at 500 nodes FAIL on a "Jain's fairness index"
of 3853 and 5035. That is a formatting defect in the harness's summary
table, not a fairness result. The block's mean NRL of 10 114.56 overflows
its fixed-width column and runs into the throughput column
(
1.0810114.56). The checker reads that table by position, so every column after it shifts by one, and "Jain" is the jitter column. The readings here come from the per-seed##RUN##rows, which are space-separated and unaffected. Filed as #741. - Every WARN is a known caveat: churn-dominated path diversity, the oracle's no-path lookups, and ICMP re-injections.
Why AntHocNet collapses at 500 nodes: the v2.5.0 screen (pre-registered, exploratory)¶
The diagnosis (#740), read from the committed v2.4.0 cells:
- The loss is not at the MAC. At 500 nodes AntHocNet loses 11–18 % of offered packets on the channel and under 0.5 % at the MAC, against AODV's 35–41 % on the channel.
- It is the reconvergence hold. Route drops at a node that had a route and
lost it reach 49–64 % of offered packets at 500 nodes, against 1.4 % at 50.
The hold is capped at
ReconvHoldCap= 200 ms, while a ~15-hop re-discovery takes seconds. 96–98 % of reconv-held packets age out at 500 nodes, against 25–30 % at 50 and 42–62 % at 200. - The adapter re-floods. The ns-3 retry timer
(
ReactiveRetryInterval= 0.25 s) launches a reactive ant from every node holding data for a lost route, bypassing the core's own one-per-second per-destination limit. That fits reactive ants rising from 27 % to 90 % of control traffic.
The screen (tools/bench/campaigns/v2.5.0-scale-screen.yaml) runs four
arms at 500 nodes on seeds 1–4, AntHocNet only, paired with the committed
scale-500-v240 control:
| arm | override |
|---|---|
hold1s |
ReconvHoldCap=1s |
retry1s |
ReactiveRetryInterval=1s |
both |
both overrides |
retry0 |
ReactiveRetryInterval=0s (the timer off, pre-#21) |
A recheck job re-runs the control's seeds 1–2 (AntHocNet + AODV) on
benchmark-cell.yml. Its ##RUN## rows must equal the committed cell's,
so each arm's delta is attributable to the arm; it is also the old-path
vs new-path control for #746.
Rule, fixed before dispatch. An arm goes to stage 2 if its paired dPDR at 500 nodes is at least +5 pp with the 95 % CI excluding zero. If none does, the arm with the largest paired dPDR whose CI excludes zero goes. If no CI excludes zero, the hypothesis is not supported and #740 says so. No number from this screen is published. Stage 2 (50 / 200 / 500 nodes, 20 seeds, paired, no regression at 50) gets its own pre-registered plan.
Screen result (dispatched 2026-10-27, collected 2026-10-28; exploratory,
not published). The recheck reproduced the committed scale-500-v240
##RUN## rows for seeds 1–2, AntHocNet and AODV, byte for byte, so each arm's
delta below belongs to the arm. Paired against the control, n = 4 at 500 nodes:
| arm | paired dPDR | 95 % CI | rule |
|---|---|---|---|
retry0 |
+34.75 pp | [+20.94, +48.56] | passes (≥ +5 pp, CI excludes 0) |
retry1s |
+15.47 pp | [−2.14, +33.09] | CI spans 0 |
both |
+4.47 pp | [−0.84, +9.79] | CI spans 0 |
hold1s |
−2.25 pp | [−6.29, +1.79] | CI spans 0 (4/4 seeds negative) |
The reading is the diagnosis's second half. The adapter's 0.25 s retry timer, which floods from every holding node, is what collapses the 500-node field. Lengthening the hold alone does not help, and combining it with a slower retry takes back most of what the slower retry gains.
Stage 2 (tools/bench/campaigns/v2.5.0-scale-stage2.yaml, pre-registered
before dispatch) runs retry0 at 50, 200 and 500 nodes, 20 seeds each,
AntHocNet only, paired by seed with the committed scale-{50,200,500}-v240
controls. Rule:
- supported at scale: the paired dPDR at 500 nodes is above zero, with its 95 % CI excluding zero;
- no regression at 50 nodes: the paired dPDR CI at 50 nodes does not lie wholly below −1 pp;
- 200 nodes is reported, not gated.
If both hold, ReactiveRetryInterval=0s is the documented operating point for
large fields, and the default goes to an every-family A/B in a later release
(golden rule 8). No default moves on this evidence.
Stage 2 result (dispatched and collected 2026-10-28; cells
results/cells/scale-{50,200,500}-v250s2.txt, 20 seeds each, AntHocNet only,
paired by seed with scale-{50,200,500}-v240):
| nodes | paired dPDR | 95 % CI | seeds | d NRL | d delay99 | rule |
|---|---|---|---|---|---|---|
| 50 | −1.97 pp | [−2.85, −1.09] | 17/20 negative | −0.87 [−1.08, −0.65] | −66 ms [−175, +48] | fails: CI wholly below −1 pp |
| 200 | +4.92 pp | [+0.28, +9.56] | 13/20 positive | −94.1 [−129.6, −58.6] | −322 ms [−445, −208] | reported |
| 500 | +33.91 pp | [+29.73, +38.09] | 20/20 positive | −6745 [−8187, −5302] | −683 ms [−947, −422] | passes |
At 500 nodes the arm takes AntHocNet from 13.3 % to 47.2 % PDR and cuts NRL by 90 %. That confirms the diagnosis: the adapter's 0.25 s retry flood is the collapse. At 50 nodes the same switch costs 2 pp. There, the fast retry recovers packets that the core's one-per-second limit would let age out of the hold.
The pre-registered branch applies: helps at scale, costs small fields.
ReactiveRetryInterval=0s is not a default candidate. The follow-up is a
gated, size-aware mechanism: the retry routed through the core's
rate-limited emission, default off, A/B'd in every family
(#760).
Two campaign-path checks rode along with stage 2:
- The scale-500 seeds 1–4 reproduce the screen's rows byte for byte across two commits (c20b058 and 5b1c3d0).
campaign.py collecthad keyed its artifact cache by label, so it first read the screen's artifacts for those seeds. The##RUN##rows were identical, and the cells committed here carry the stage-2 runs (#759).
Earlier evidence that no constant here is a default candidate: v2.2.0's
reconv1s arm (the same override as hold1s) gained +4 to +6 pp on VANET and
FANET and lost 1.4 and 6.0 pp on the grid Nakagami cells
(v2.2.0 campaign). A fix that helps here ships as a
gated mechanism, default off (golden rule 8).